Data selection
Steps
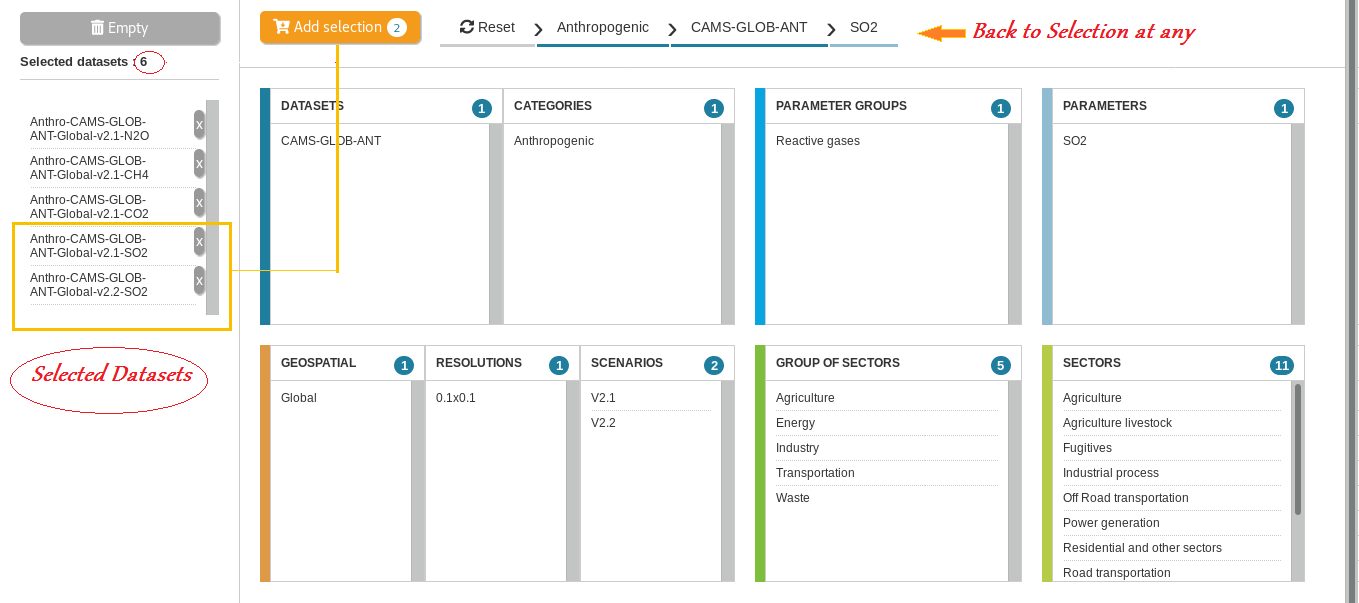
- Select items by sequential steps, starting from any item
- Add selection to cart

More …
- Go back at any step using the navigation path

- Reset to initial state

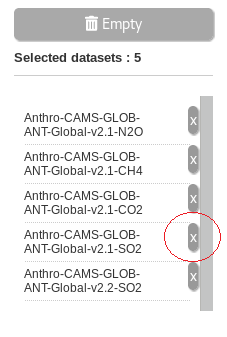
- Empty cart or delete one element from cart
Map Display
Steps
- Select file among list
- Select date/unit/sector
Display options
- Color table | Scale linear/log
- Range Min/Max
Draw time series
- At a specific location : click on the map
 Over bounding box : enter latitude and longitude coordinate and press ‘Draw Time Series’ buttonunder construction
Long time series may take a few seconds to display
Regional analysis
- Select a regional mask
Existing masks : continents, countries, cities, IMAGE2.4 regions, GFED regions
Galerie introuvable !Time Series
- Select one or more sectors
- Select one or more regions
- Hide items from legend
Map Compare
- Select second Dataset
- Choose Arithmetic function
- Press Map Compare
Data Download
- Data NetCDF files
- 3 options
- Regional analysis CSV files